 Przemyslaw Radomski, CFA: Since my previous essay the short-term situation in light crude has improved. The second half of last week was very good for the oil bulls. U.S. crude oil prices climbed up as robust economic data from the United States and China brightened the outlook for demand in the world’s two largest oil consumers. Investors were also encouraged as the U.S. Federal Reserve, at the end of a two-day meeting, showed no signs of reducing the economic stimulus that has broadly underpinned commodities’ prices. These positive circumstances resulted in a two-day rally which took light crude to over $108 per barrel. In this way, the last week’s top almost touched the June’s peak. However, nothing good lasts forever and oil prices dropped on Friday after weak U.S. job numbers disappointed investors.
The beginning of this week brought further deterioration and the price of light crude slipped below $106 per barrel. According to Reuters, oil fell on Tuesday as Iran’s new president signaled willingness to negotiate with the West over Tehran’s disputed nuclear program.
Having discussed this interesting piece of data, let’s take a closer look at the light crude’s charts and find out what impact these circumstances had on the price. Have they changed the outlook for light crude? Where are the nearest support zones and resistance levels? What’s the current outlook for U.S. crude oil?
As I wrote in my previous essay on crude oil:
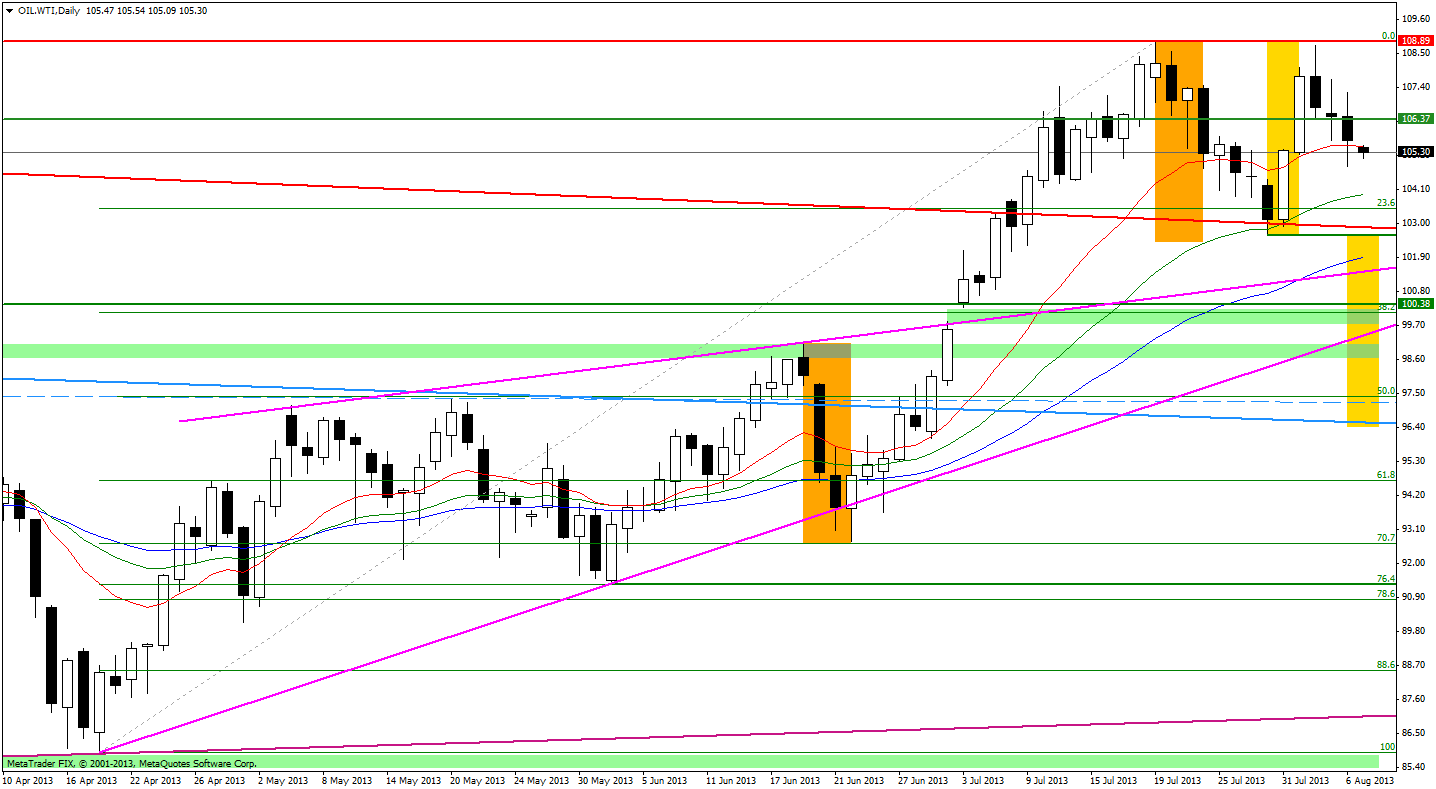
(…) the oil bears showed their claws and triggered a correction which took oil price below (…) $105 per barrel. (…) this area is supported by the July 15 low which, together with the bottom of the last corrective move (the July 11 low), forms a strong support zone. The next support level is based on the upper line of the large triangle based on the May 2011 and March 2012 heights (the red bold line).
As we see on the above chart, after several unsuccessful attempts the sellers managed to push the price below the July 11 low and reached the upper line of the large triangle (the red bold line) on July 30. It’s worth noting that the oil bears broke below it only on an intraday basis.
This strong support level encouraged buyers to act and light crude rebounded sharply in the following days. That increase led light crude’s price to over $108 per barrel once again on Friday. In this way, the oil bulls almost touched the July’s four-month high. However, closeness to this strong resistance level encouraged investors to take profits after strong growth.
Taking this into account, in the following days we may see a bearish scenario. In this case the first support is the bottom of the last corrective move (the July 30 low) which, together with the upper line of the large triangle (the red bold line), forms a strong support zone.
(...)Click here to continue reading the original ETFDailyNews.com article: Crude Oil: Double Top or Just a Pause? You are viewing an abbreviated republication of ETF Daily News content. You can find full ETF Daily News articles on (www.etfdailynews.com)
![]()
You are viewing an abbreviated republication of ETF Daily News content. You can find full ETF Daily News articles on (www.etfdailynews.com)
![]()
